Text types: Text formats for presenting information
| Charts & diagrams |
Compare / contrast
We often need to show how things are similar (comparing) and how things are different (contrasting). This is done very easily using various kinds of diagrams, charts and graphs.
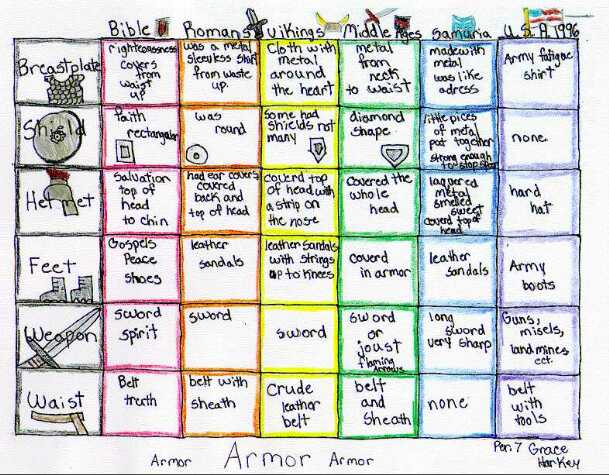
A common compare / contrast diagram is a matrix. The following matrix diagram was made by school children to show the differences and similarities between various soldiers throughout the ages. In the diagram, the different types of soldiers are listed in the top row. In the first column, different types of armour are listed. The students have made notes from their research of the various types of armour used by each type of soldier. They are now able to compare and contrast the armour by referring to their matrix.
Here is a matrix diagram that you can adapt when you are doing comparing and contrasting activities with your students:
Another useful diagram for comparing and contrasting is the Venn diagram. This allows you to show the features that are common and those that are different.
Graphs are another way of comparing things. Students can collect information and then make a graph recording their findings. From the graph they can write up a summary (eg In 1999 there were more boys than girls in our school. But in 2000, there were more girls than boys.)
For more information on comparing and contrasting, see ![]() Communicative functions: Describing experience: Who or what is involved?:
Making comparisons
Communicative functions: Describing experience: Who or what is involved?:
Making comparisons
|
Tell me more ... Using
charts and diagrams |
![]()
|
||
To give us feedback about this section, click here or on the Comment button at the top of the screen.
If you have any questions about this section, visit the Language Corner.
If you have any questions or suggestions about how to teach this section, send a message to the Teaching Corner.